CH 2 - Scripting (Programming) Languages
I found the Python language via R. Specifically, I did the analyses for my dissertation exclusively in R. When I was trying to develop a web interface to my results (pre R-Shiny), I stumbled across Ruby on Rails and RSRuby. As I followed the trail, I realized it was a fork of R2Py and wham, discovered Python. My first experience of PyCon was like walking into Lothlórien. It felt like an epiphany at the time and I’ve never looked back.

Python plus R: the killer combo
Why Python (my personal favorite)
It’s relatively easy to get started
You get the other languages you need with it (e.g. R, Scala, C)
It’s a Swiss Army Knife for everything from web development to natural language to video games to robotics and hacking
One ring to rule them all
Installing Python (Conda Distribution)
I’m hesitant to recommend a particular vendor, but installing Python for scientific computing can be a challange. The Anaconda (it's a snake ... get it) folks have resolved many of headaches (e.g. SciPy installation)
#install anaconda python with Homebrew
brew cask install Anaconda
Maintaining Python (Conda Distribution)
What About R
R (another fantastic language) was written initially by statisticians for statisticians; in that capacity it is excellent. Indeed my university stats professor was an early adopter. He'd tired of developing methods only to have to pay a license so his students could use an outdated version of his own method. Unfortuntely, from teaching and training colleagues and students, I've found the learning curve can be needlessly steep, it is mostly limited to analytics, the input/output is excruciating, and the parts don’t quite work together. You can get around many of these issues with Python. However, if you are doing an analysis it is THE definitive source of packages and the dataframe concept is pure genius. RShiny has made it easy to share your results online, RStudio is a slick graphical user interface (GUI), and the stats libraries are industry standard (period).
Installing R (with Conda)
Just the core
conda install -c r r-essentials
All the things
brew tap homebrew/science
brew install Rbrew install Caskroom/cask/rstudio
Python vs R, moreso Python plus R
I consider Python to be more versatile for my use case as a full-stack data scientist. So, how does one get the benefits of R without the downsides of R.
1) Call R from Python to access the libraries
2) Pandas dataframes in Python
1) Calling R from Python
Install RPY2
conda install rpy2Jupyter notebook
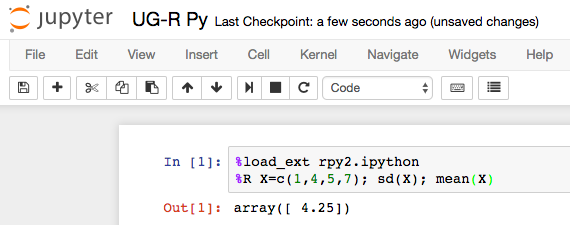
Load and run RPY2 in a Jupyter Notebook
Point your browser to http://localhost:8888/
Then enter this into the first cell and press CMD⌘ + Enter`
%load_ext rpy2.ipython
%R X=c(1,4,5,7); sd(X); mean(X)
This should return
array([ 4.25])
2) Pandas DataFrames
Pandas DataFrames revolutionized the Python workflow and were an R-killer for me. Beyond dataframes, I find Pandas to be THE most useful framework for analytics in Python. A DataFrame can be conceptualized like a souped-up Excel spreadsheet. You have a grid with rows and columns of data, except the cells can contain diverse of types of information, beyond a simple value, such as arrays, lists, dictionaries. A DataFrame consists of 3 keys components: the data, the index, and the columns.
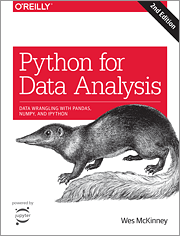
The definiative guide to Pandas is written by Wes Mckinney, the author of the package/concept. There is a new 2nd edition available as of Sept 25, 2017. I can't recommend this book enough...
Intro to DataFrames
Intro to Pandas
Combining Python, DataFrames, and R
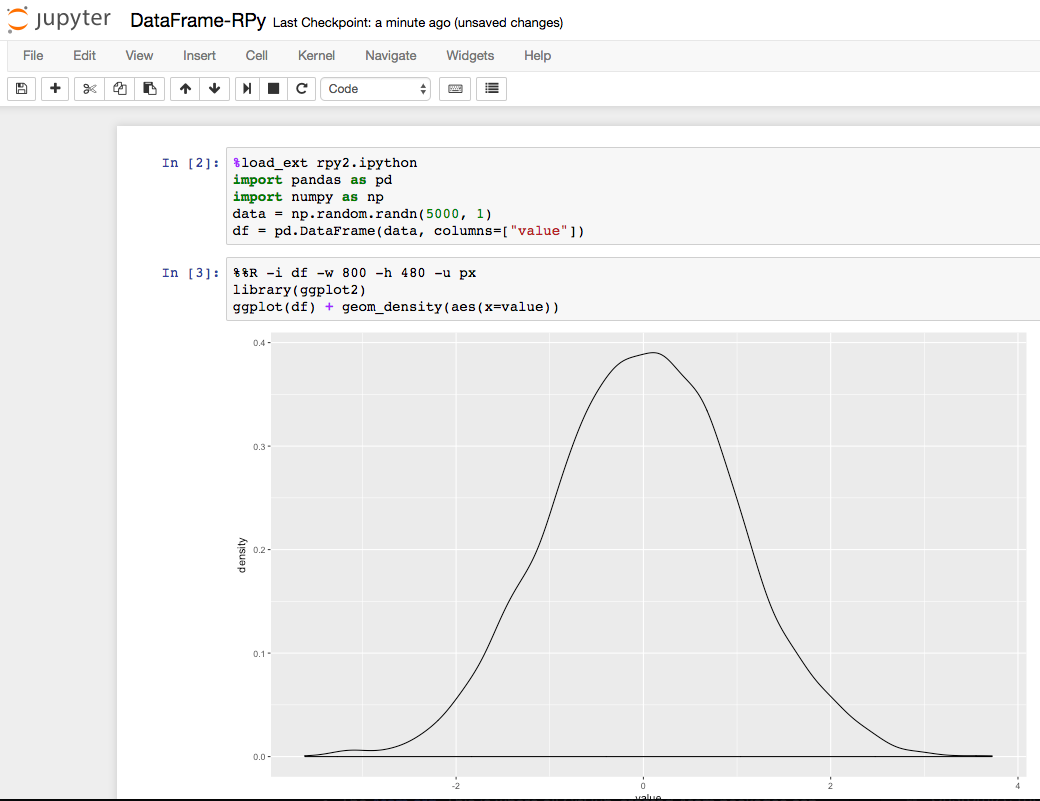
Let’s graph a Python dataframe with R’s GGplot
conda install -c r r-ggplot2
Now run this code in a Jupyter notebook
Cell #1
%load_ext rpy2.ipython
import pandas as pd
import numpy as np
data = np.random.randn(5000,1)
df = pd.DataFrame(data, columns=["value"])
Cell #2
%%R -i df -w800-h480-u px
library(ggplot2)
ggplot(df) + geom_density(aes(x=value))
Source https://ragrawal.wordpress.com/2016/08/03/using-r-ggplot-within-ipython-notebook/
Javascript
(in progress)
Javascript has taken over our visualization layer. It may also someday take over our modeling work. We do our web developement with Node.js and visualizations with D3.js.
Node.js
Node.js is a full-stack framework for web development. It has recently supplanted a variety of Python, .Net, Ruby, and PHP frameworks (remember this is opinionated). Full-stack in this instance means, that both the back- and front-end is accomplished with Node in Javascript. You don't have a web visualization layer in one language calling back to a server in another.
To install Node.js, use homebrew to install nvm
brew install nvm
nvm install 0.10
nvm alias default 0.10
To make the Node availalbe on the command line, add it to your .bash_profile, e.g.
cd ~
atom .bash_profile
Then paste in
source $(brew --prefix nvm)/nvm.sh
Upgrade to the latest Node package manager (npm)
npm install -g npm@latest
Scala
(in progress)
Scala has quickly become the language of distributed processing. This allows data scientists to run massive compute jobs across multiple machines (nodes). The language has some similarities in syntax to Java (no relation to Javascript), so it can be picked up quickly by comp sci students with Java backgrounds and developers can be easier to find and retrain.
Our main use for Scala has been for programming Spark. This is THE solution for distributed processing, it supplants Hadoop and its derivates for doing massive MapReduce computations and other distributed tasks. You can get away with using PySpark, the python bindings, but we've found that they lag the release of Scala capabilities for Spark. It is worth adding this language to your coding quiver.